Individual experiment overview
Detailed overview of running an experiment and seeing its results.
After creating an experiment with all model parameters, the user now can run the experiment. After clicking on "Start Experiment", it may take some time for the experiment to get the proper GPU and CPU resources from the cloud server and for them to start working on the provided datasets. The amount of time required will largely depend upon the volume of the dataset but the underlying model parameters might also affect it.
After completion of the experiment, the user is able to view several things. The user is able to see the GPU consumption, running time, inference time, mAP, and Average loss.
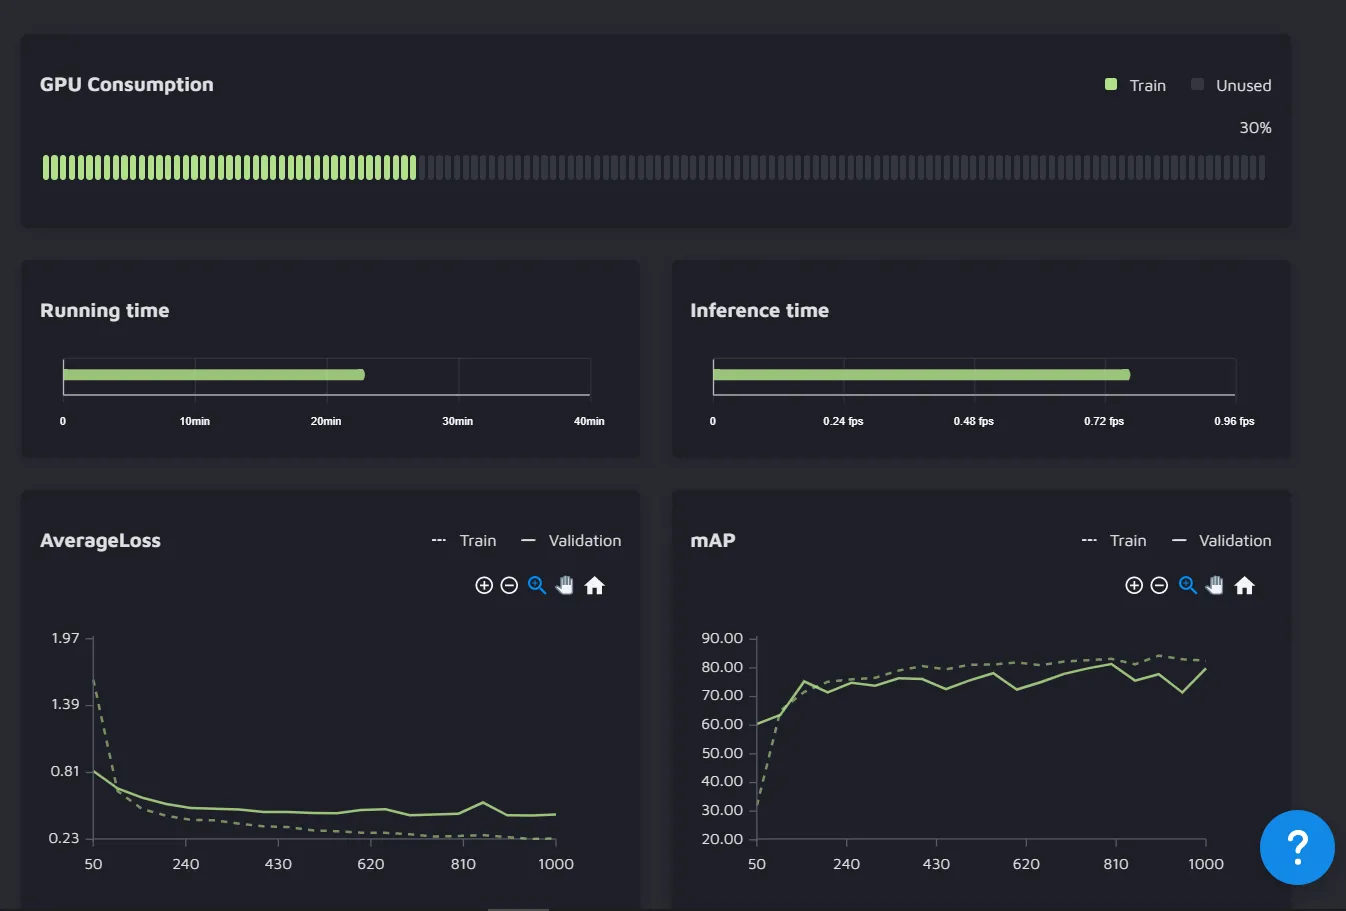
This is an example of the instance segmentation experiment. The average loss and the mAP have been plotted for both the training and the validation data.
The user can also view the confidence scores with which different objects in the validation images were segmented.
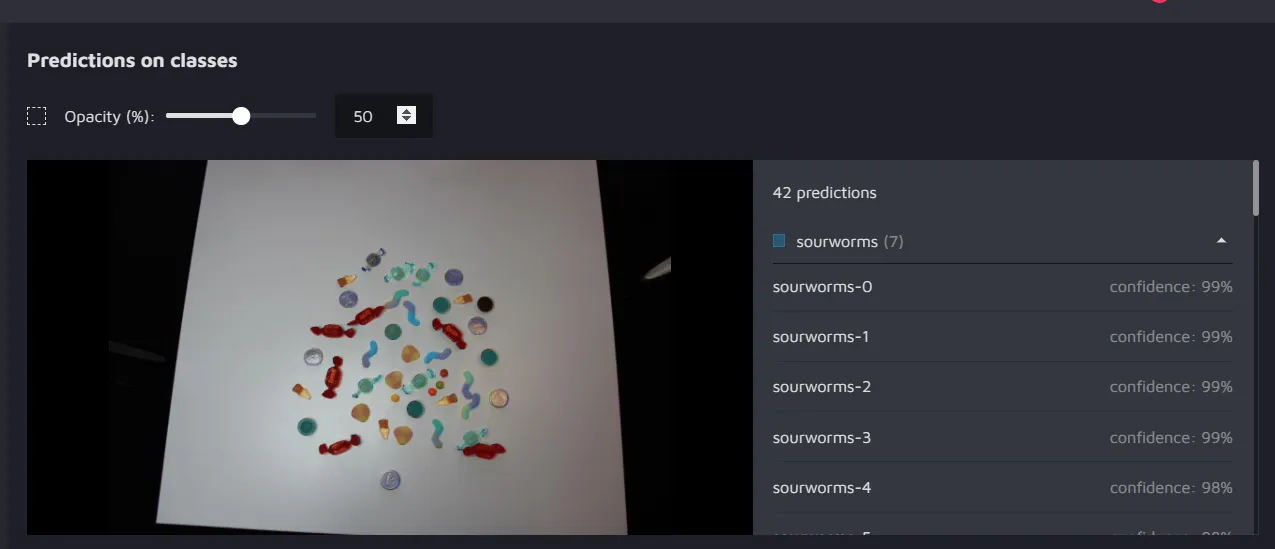
Here is one of the images of the validation set with 42 predictions of different classes and their respective confidence.