Explainability and Saliency maps
Understanding why your model makes a specific prediction might be beneficial. The Hasty Explainability feature helps you visualize the results of an experiment by using saliency maps.
Explainability might help you get insights on the questions like:
- Why did the model choose a specific label?
- What part of the image was important in leading the model to a particular decision?
- What are the biases that can decrease the model’s performance?
To understand how the feature works, let’s observe the basic concept of explainability first.
Why explainability matters
Neural networks and deep learning brought a massive advancement to the Artificial Intelligence domain. Model predictions got more precise, and ML tasks - more complex. However, it became harder and harder for humans to understand the reasoning behind the model’s decisions. This phenomenon is known as a black-box problem - when only the input and the output of the model are available, with the rest of the algorithm being obscure.
The black-box paradigm might be problematic for several reasons:
- Lack of trust towards the model. By default, AI does not share humans' values and norms. If we do not understand how the model “thinks,“ how can we be sure it makes the best decision in a critical situation or some edge case?
- Problems with model evaluation and improvement. AI can make mistakes, so to enhance the model’s performance, it is crucial to understand why exactly they occur. Moreover, the model’s output can be correct but based on wrong assumptions. Detecting, identifying, and reviewing weaknesses is important to avoid fatal mistakes in the future.
That is where the Explainability concept steps in. It stands for creating a transparent AI which is comprehensible to humans and is available for a thorough evaluation.
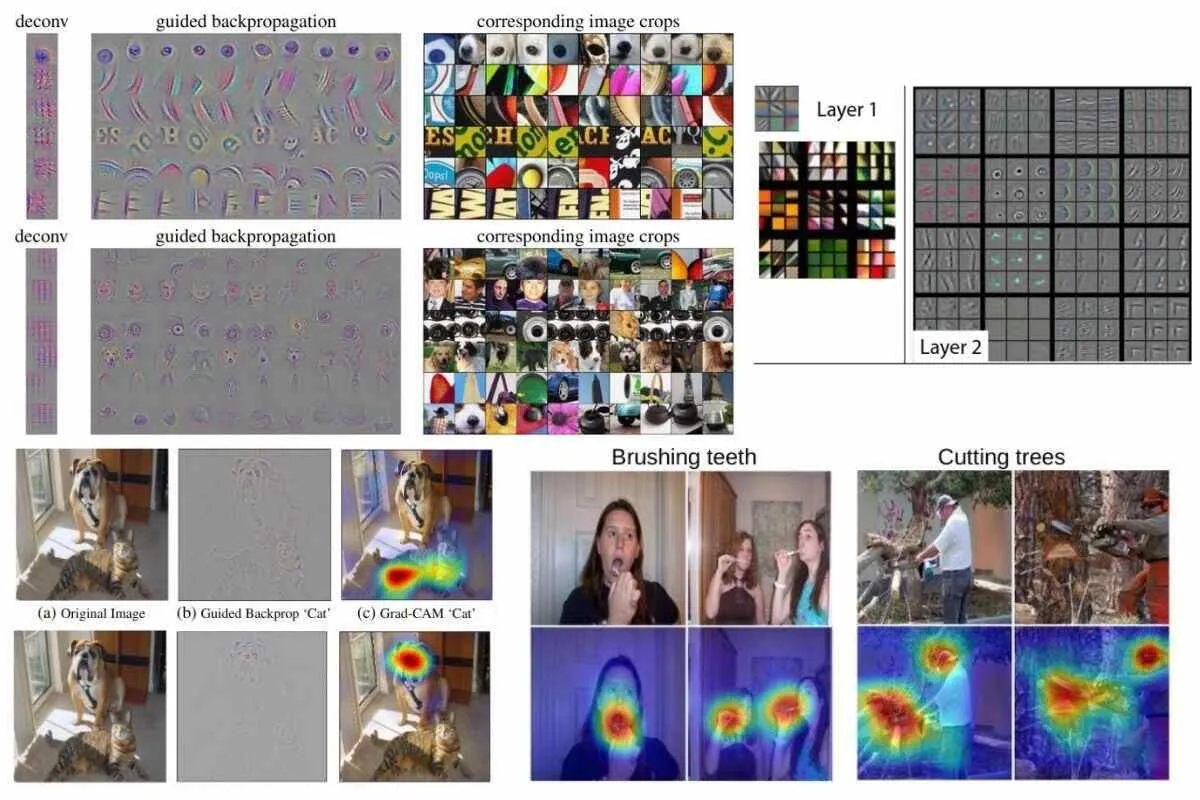
In computer vision, saliency maps are one of the methods used to interpret what neural networks see.
Saliency maps

Consider this image. For you, it is obvious that there is a dog in the picture. However, neural networks require to be trained on hundreds and thousands of images before they can recognize a dog, and even after that, they might make wrong predictions in edge-cases, like this one:

Source
Even when the prediction is made correctly, you might wonder what exactly makes the model think it is a dog: is it the nose, the ears, or the proportions of the head?
Saliency maps help researchers understand the importance of different features in the model’s “eyes” by visualizing the images in the form of heatmaps or grayscale images, depending on the method. The hottest (most red) regions (in the case of the heatmap) or the brightest pixels (in the case of the grayscale image) point out the areas of an image which had a significant influence on the model’s prediction.
Source
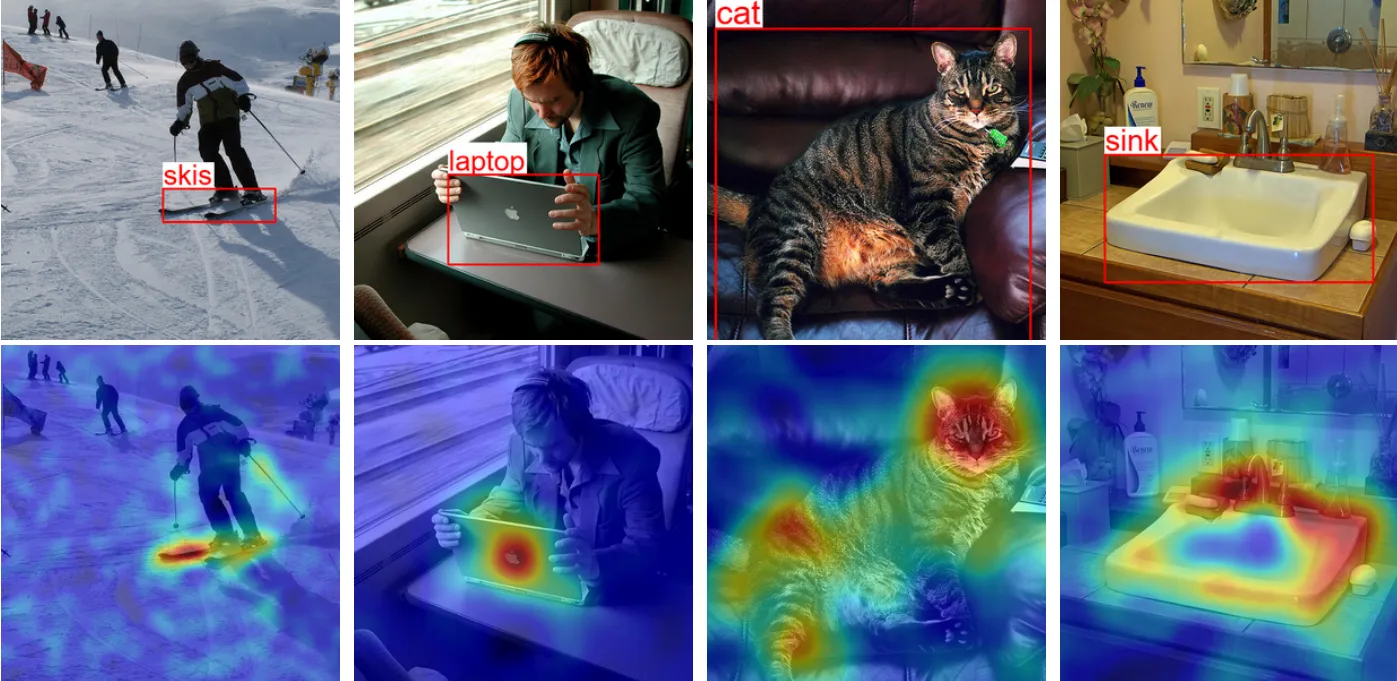
Models for saliency maps
In Hasty, we use two models to create saliency maps:
- D-RISE (Detector Randomized Input Sampling for Explanation) is used for Object Detection and Instance Segmentation tasks. It is a black-box method, meaning that it requires only the inputs and outputs of your model to create a saliency map. The D-RISE algorithm does not need to know the architecture, weights, and other parameters of your model, and thus, it can be applied to different object detectors – both one-stage (YOLO, SSD, CornerNet) and two-stage (Faster R-CNN) ones.
The saliency maps produced by D-RISE are represented by heatmaps.
Source
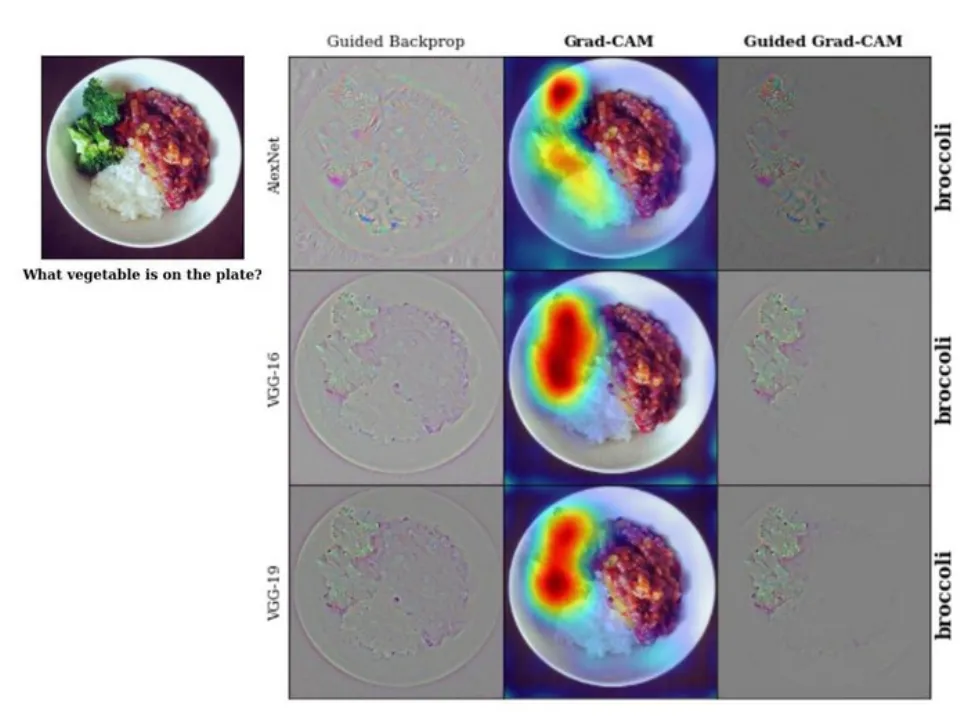
- Grad-CAM (Gradient-weighted Class Activation Mapping) is applied to explain the results of Classifier, Tagger, Attributor, and Semantic Segmentation models. Grad-CAM is a generalized variation of the CAM (Class Activation Mapping) method. It does not require changes in the model’s architecture and can be applied to a broad spectrum of CNN model families.
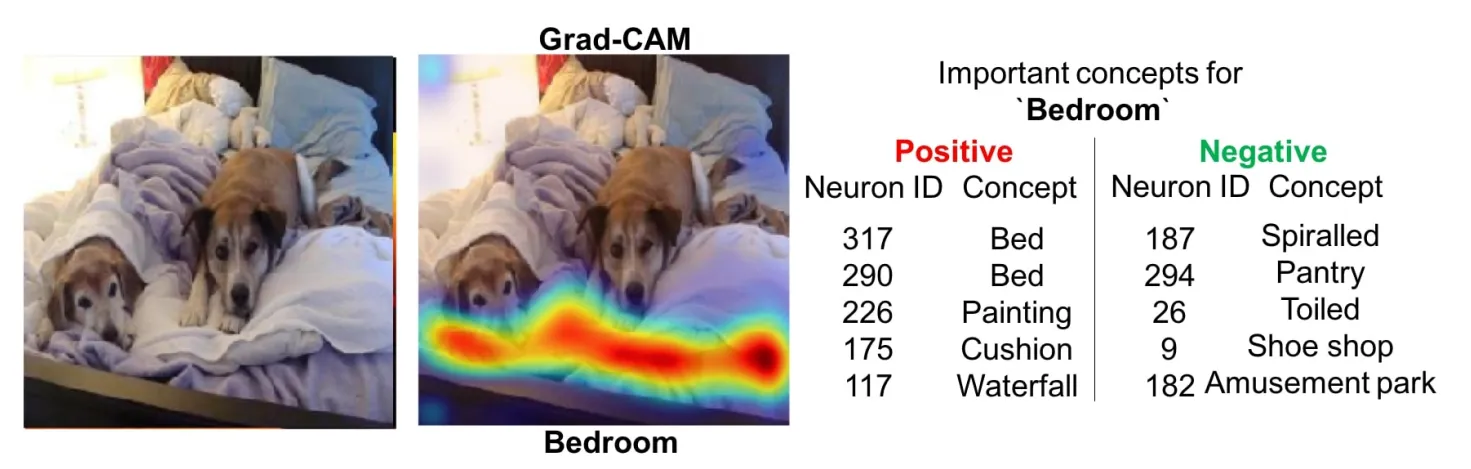
Why use saliency maps
With saliency maps, you can analyze the image regions or features that stood out across the whole dataset. These insights might help you understand whether your model picks up on the key features and retrain it if some biases are present.
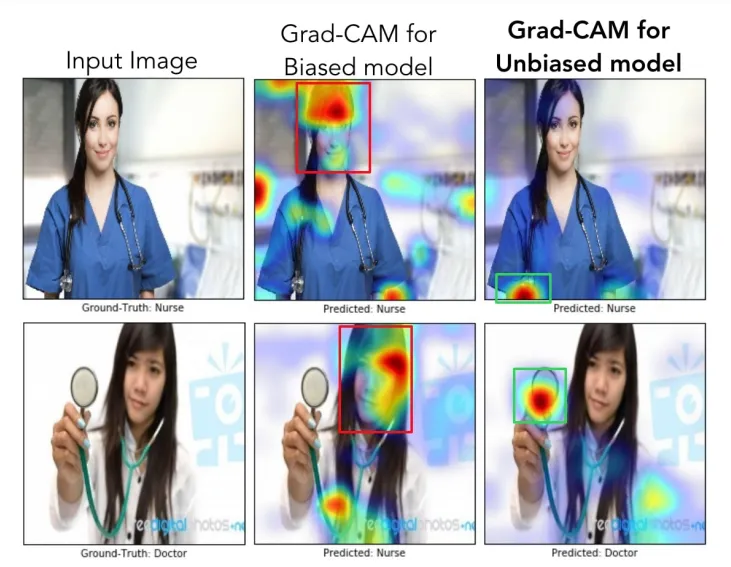
For example, in the case above (the classification of doctors and nurses), the biased model made predictions based mainly on a person’s face and hairstyle. This led to female doctors being misclassified as nurses. In contrast, the unbiased model considered the white coat and the stethoscope as more important features and, therefore, made more correct predictions.
In the case below, the model recognized cats worse when they were in a cage.

Once we have this insight, we can add more images with cats behind the cage into our training set. Additionally, we can augment the images to increase the efficiency of training.

Source
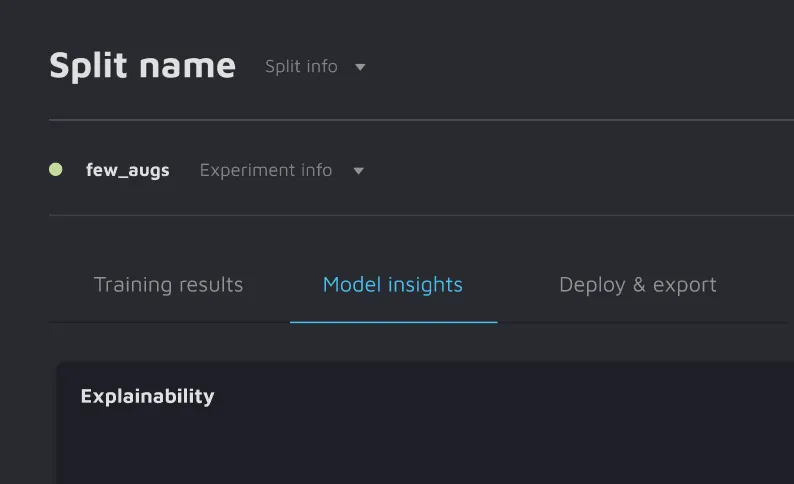
How to access the Explainability feature in Hasty
1. Open Model Playground;
2. Select the split and a completed experiment;
3. Next to current training results, you will see the Model insights tab;
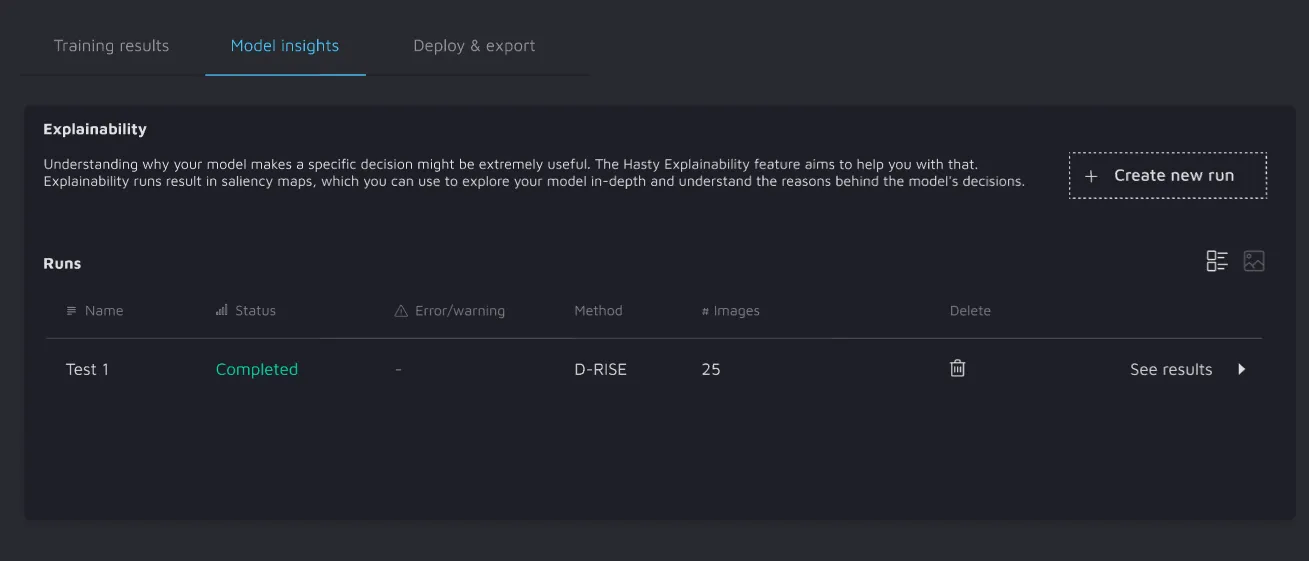
4. Within the Model insights tab, create an Explainability run. You should:
- Set the run’s name;
- Choose the explainability method: D-RISE or Grad-CAM;
- Set the number of images used for the run: images will be randomly selected from the validation set of this Model Playground experiment.

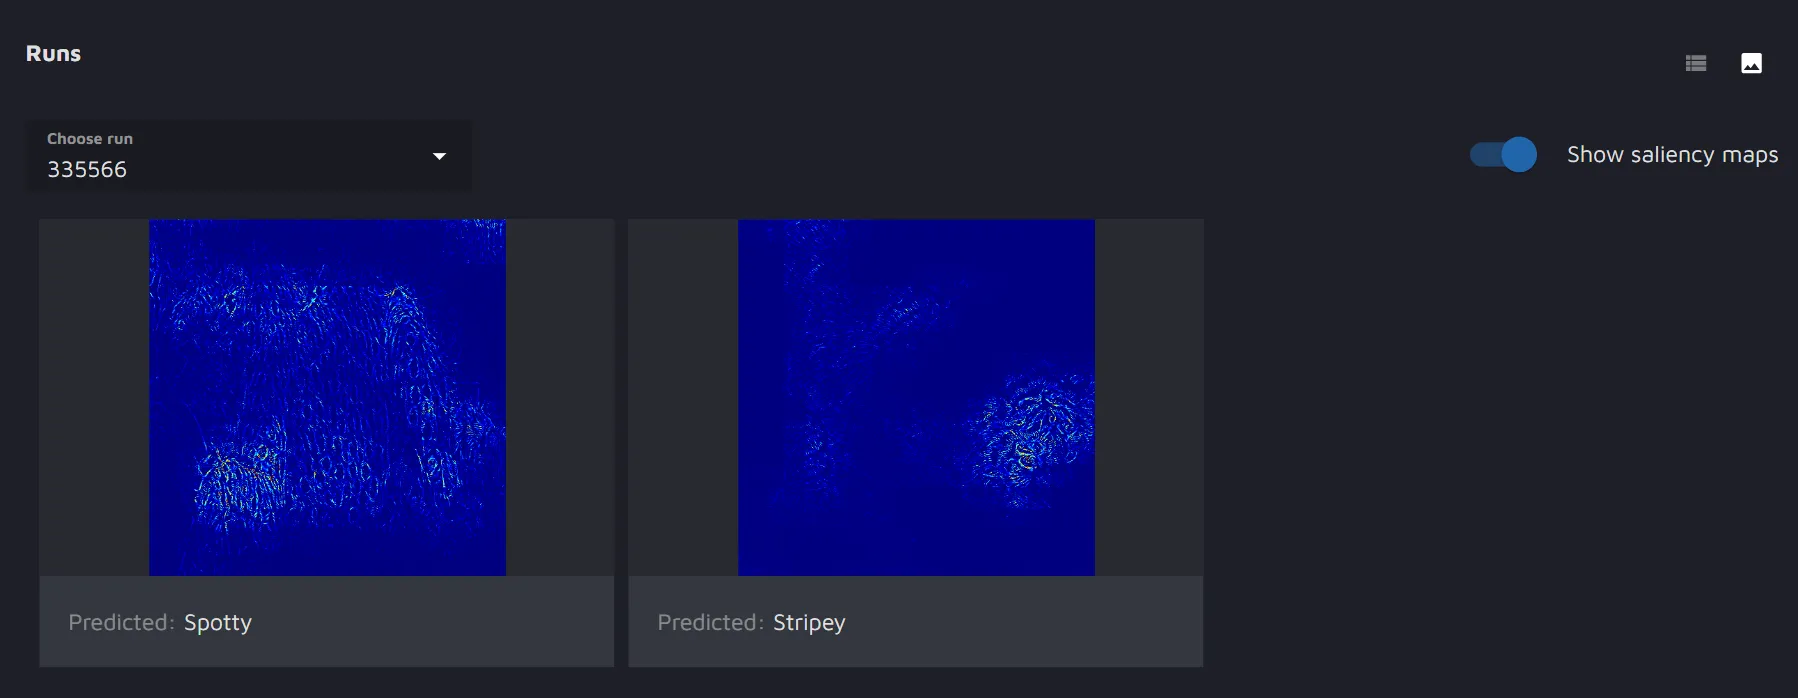
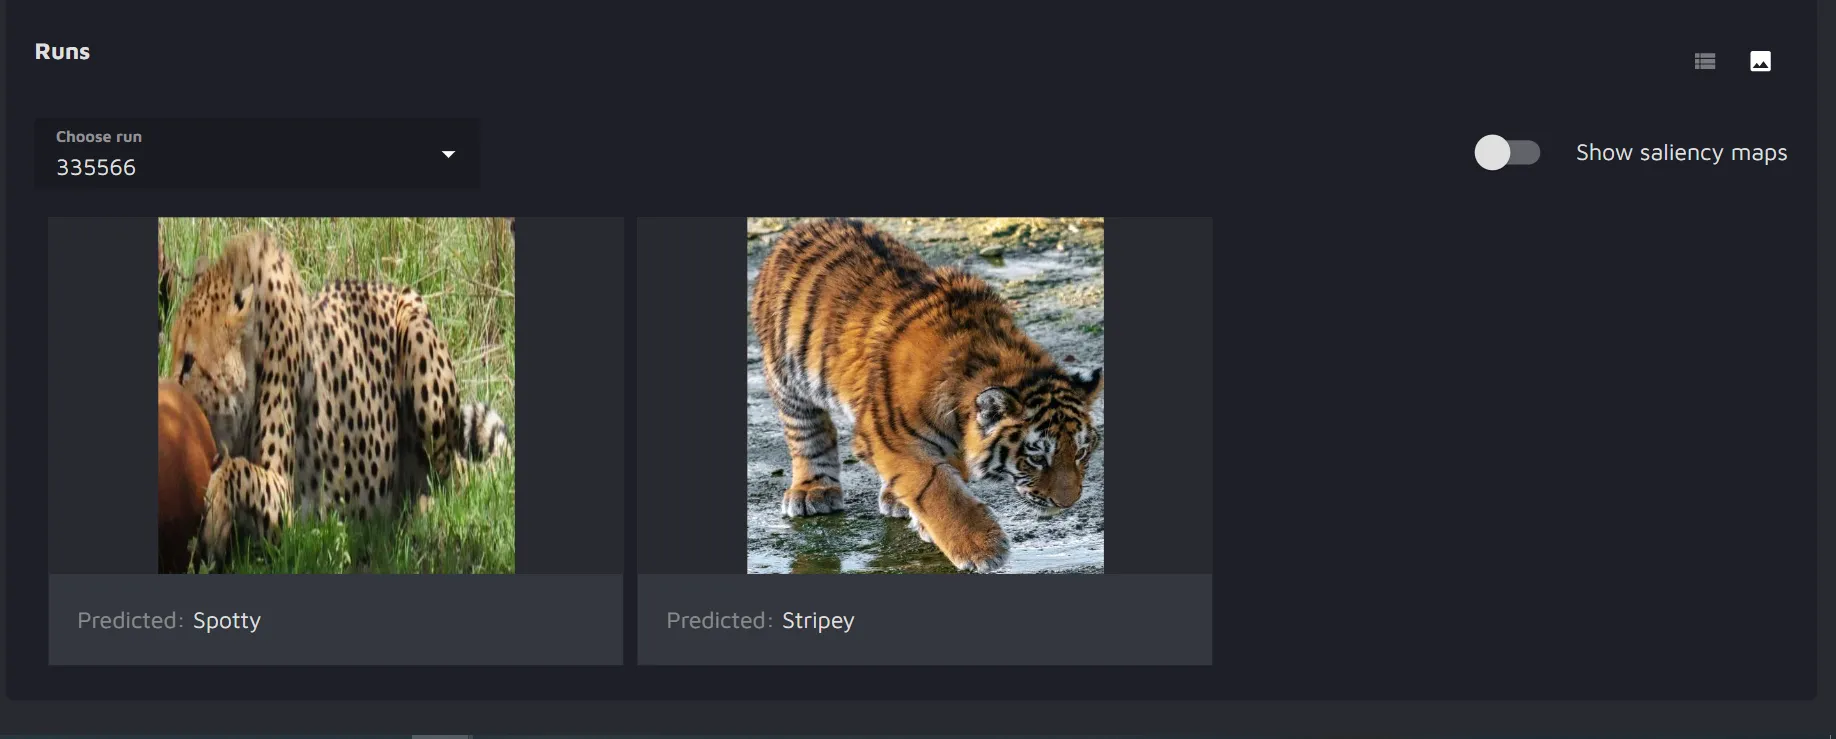
5. To access saliency maps produced by your run, please navigate to the Insights tab of the Explainability widget.
When the run is completed, you will see the results listed as images. You will have the possibility to toggle the saliency map on and off.
Summary
Explainability is an essential concept in AI that helps understand the decisions made by the models and build confidence in their predictions.
You might benefit from the Explainability feature in Hasty if you want to:
- Evaluate your OD/IS/Classification model and track existing biases;
- Increase both the team’s and the customers' trust in the model;
- Reduce the costs by decreasing the time and expertise level required to interpret the model;
- Improve the model generalization.
Thanks for reading, and happy training!