Precision score
If you have ever tried solving a Classification task using a Machine Learning (ML) algorithm, you might have heard of a well-known Precision score ML metric. On this page, we will:
- Сover the logic behind the metric (both for the binary and multiclass cases);
- Check out the metric’s formula;
- Find out how to interpret the Precision value;
- Calculate Precision on simple examples;
- Dive a bit deeper into the Micro and Macro Precision scores;
- And see how to work with the Precision score using Python.
Let’s jump in.
What is Precision in Machine Learning?
With the Accuracy score having two drawbacks, such as the imbalance problem and being uninformative as a standalone Machine Learning metric, Data Scientists developed two new metrics that addressed the disadvantages of Accuracy and gave researchers a better view of a model’s performance.
Up-to-date, these metrics are widely used to evaluate Classification algorithms across the industry. They are called:
- Precision;
- And Recall.
To define the term, in Machine Learning, the Precision score (or just Precision) is a Classification metric featuring a fraction of predictions of the Positive class that are Positive by ground truth. In other words, Precision measures the ability of a classifier not to label as Positive a Negative sample.
In a sense, Accuracy and Precision are somewhat similar, and many newcomers mistakes these metrics as interchangeable. No, they are not. They are different in their concept, so please keep that in mind when choosing a metric for your next Machine Learning project.
Anyway, to evaluate a Classification model using the Precision score, you need to have:
- The ground truth classes;
- And the model’s predictions.
Precision score formula
The Precision score is an intuitive metric, so you should not experience any challenges in understanding it.
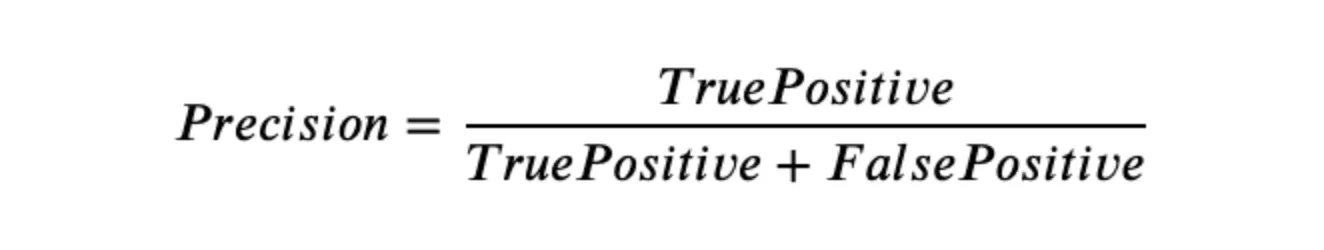
To get the Precision score value, you need to divide the True Positives
(the predicted class for a sample is Positive and the ground truth class
is also Positive) by all positive predictions - True Positives and
False Positives (the predicted class for a sample is Positive, but the
ground truth class is Negative).
Source
Precision is the metric that addresses the Accuracy imbalance problem. If the class distribution is skewed, Accuracy allows you to assign all the samples to one class and get a better metric value (although such a model does not have any predictive power). However, with Precision, it is not possible as assigning all the samples to one class leads to the growth of False Positives resulting in a worse Precision score value. Such a logic behind the metric means that you can effectively use Precision even if your data is imbalanced because the Precision score is not dependent on the class distribution.
To simplify the formula, let’s visualize it.
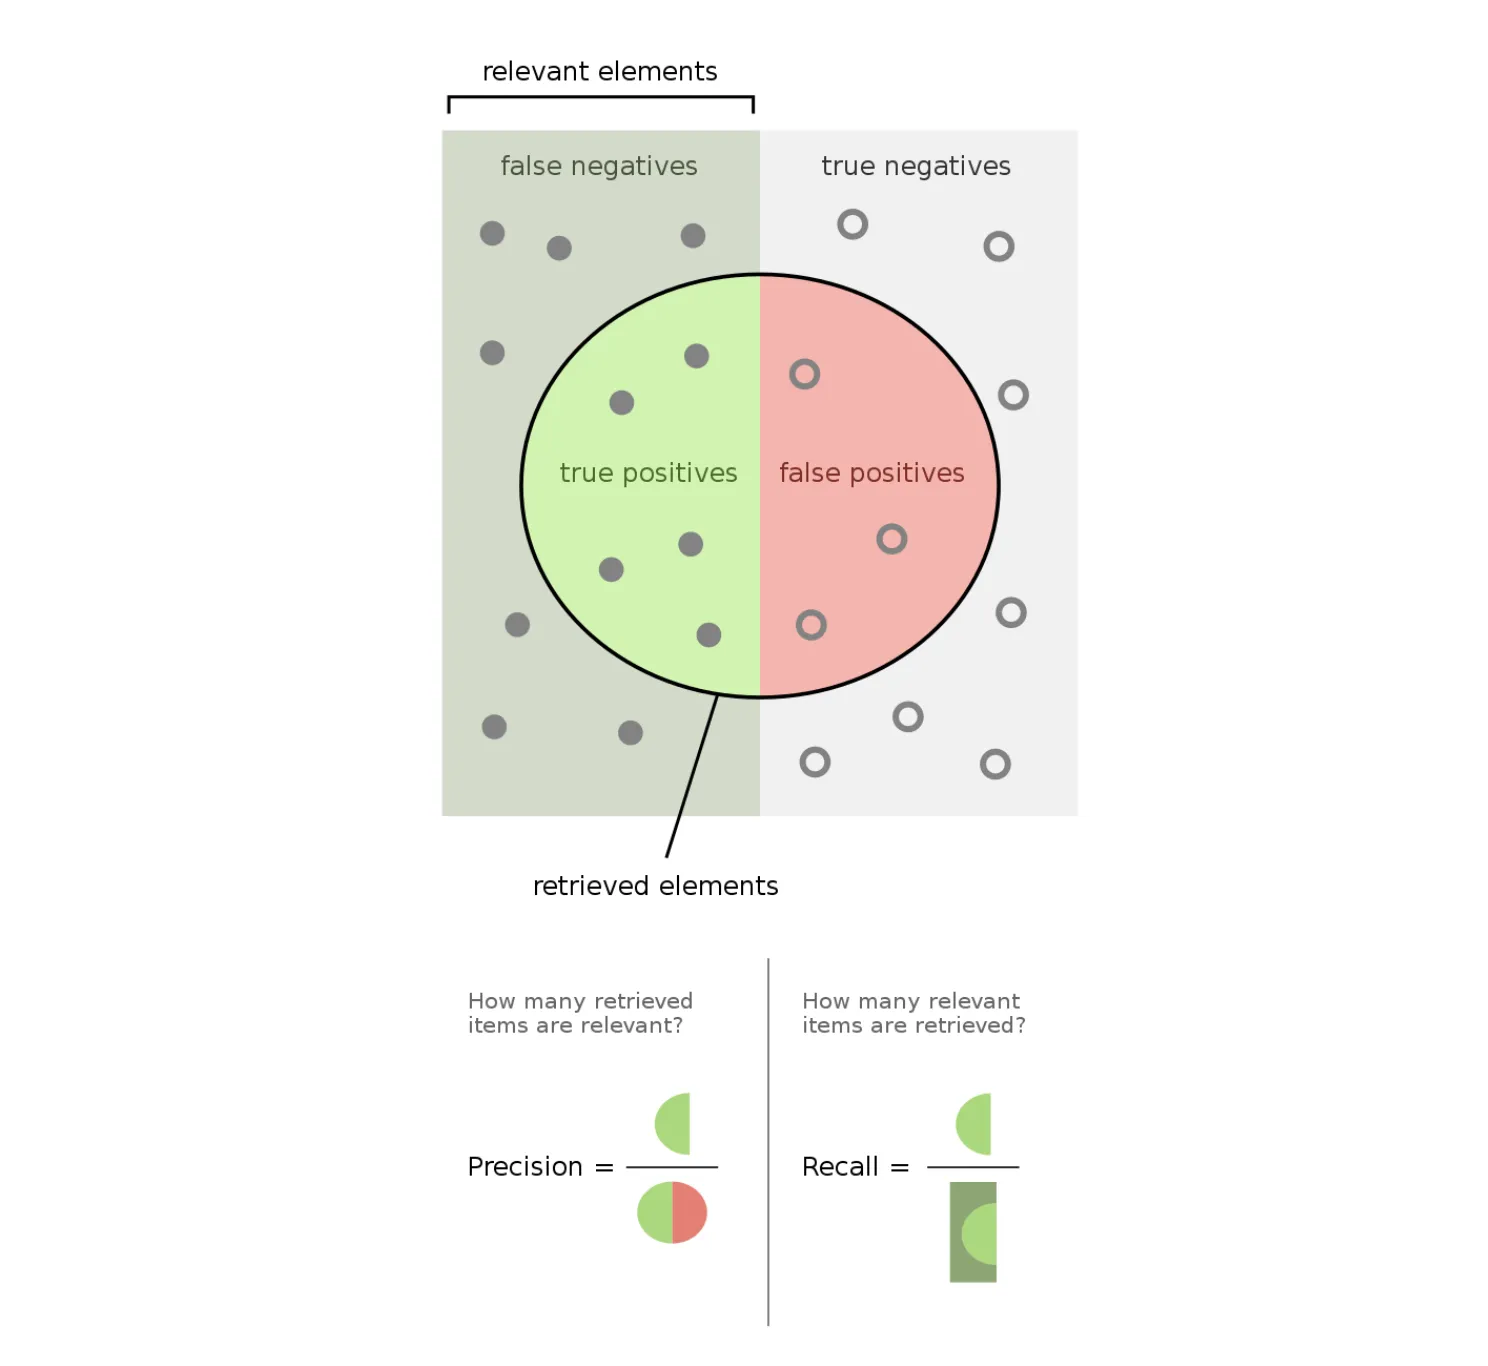
Source
As you can see, Precision can be easily described using the Confusion matrix terms such as True Positive and False Positive. Still, as described on the Confusion matrix page, these terms are mainly used for the binary Classification tasks.
So, the Precision score algorithm for the binary Classification task is as follows:
- Get predictions from your model;
- Calculate the number of True Positive and False Positive predictions;
- Use the formal Precision formula;
- And analyze the obtained value.
Multiclass Precision score
For the binary case, the workflow is straightforward. However, there are also multiclass use cases, and this is when things might get a bit tricky. In general, there are various approaches you can take when calculating Precision for the multiclass task. There are at least three different options, as you can see in the sklearn Precision score metric function:
- Micro;
- Macro;
- And Weighted.
Each of these approaches is solid and can be very helpful in model evaluation. Also, in real life, you will likely calculate the metric value using all of them to get a more comprehensive view of a problem. Please check out the micro and macro Precision score calculation examples below or the scikit-learn documentation page if you want to learn more.
So, the Precision score algorithm for the multiclass Classification task is as follows:
- Get predictions from your model;
- Identify the multiclass calculation approach you feel is the best for your task;
- Use a Machine Learning library (for example, sklearn) to do the calculations for you;
- And analyze the obtained value while keeping in mind the approach you used to get it.
Interpreting Precision score
In the Precision case, the metric value interpretation is straightforward. If you correctly classify more True Positives, it results in a higher Precision score. The higher the metric value, the better. The best possible value is 1 (if a model got all the predictions right), and the worst is 0 (if a model did not make a single correct prediction).
From our experience, for both multiclass and binary use cases, you should consider Precision > 0.85 as an excellent score, Precision > 0.7 as a good one, and any other score as the poor one. Still, you can set your own thresholds as your logic and task might vary highly from ours. Also, please be careful in the multiclass cases, as you might get a model with a high metric value on one class but a low one on the other. So, always try to see the bigger picture. Do not rely on a single value averaged across the classes.
Understanding whether you got a high or low Precision value is good, but what does this value mean in the grand scheme of things? The higher the Precision score value, the higher the probability that the classifier will not misclassify a Positive sample as a Negative. So, with high Precision, you can trust the model’s ability to correctly identify instances of the Positive class.
Precision score Vs. Accuracy score in Machine Learning
As mentioned above, newcomers often wonder whether Accuracy and Precision can be used interchangeably. The answer is - no; please do not fall into this pitfall.
At first, these two metrics might seem similar, but there is a clear-cut difference in their concepts 'physical' level. You can easily verify this by looking at the formulas of these metrics.
The Precision score looks only at True Positives and False Positives, thus focusing on the quality of the predictions of just one class. On the other hand, the Accuracy score utilizes the entire Confusion matrix to assess the model's overall performance across all the classes.
This is precisely what makes Precision less noisy than Accuracy - evaluating predictions class by class is way more thoughtful than having one number for an entire model.
Precision score calculation example
Let’s say we have a binary Classification task. For example, you are trying to determine whether a cat or a dog is on an image. You have a model and want to evaluate its performance using Prrecision. You pass 15 pictures with a cat and 20 images with a dog to the model. From the given 15 cat images, the algorithm predicts 9 pictures as the dog ones, and from the 20 dog images - 6 pictures as the cat ones. Let’s build a Confusion matrix first (you can check the detailed calculation on the Confusion matrix page).
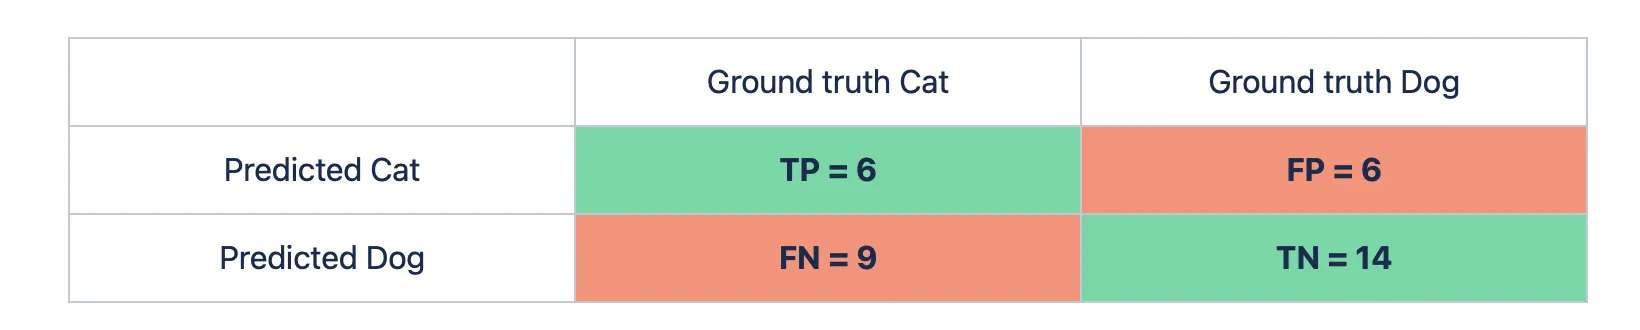
Excellent, now let’s calculate the Precision score using the formula for the binary Classification use case (the number of correct predictions is in the green cells of the table, and the number of the incorrect ones is in the red cells).
- Precision = (TP) / (TP + FP) = (6) / (6 + 6) ~ 0.5
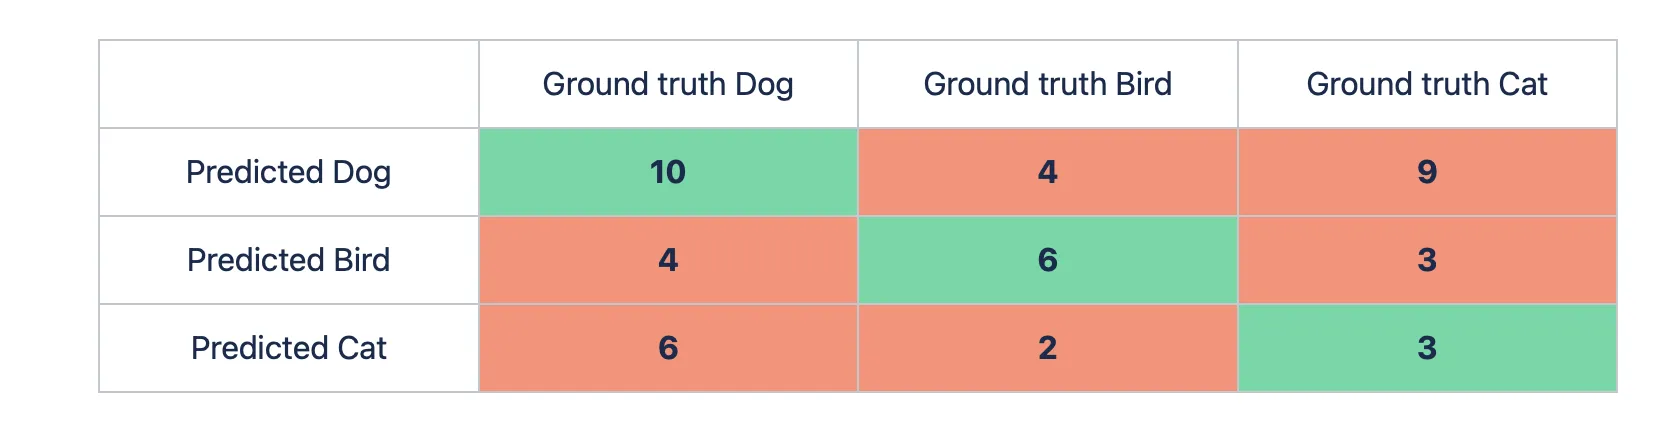
Ok, great. Let’s expand the task and add another class, for example, the bird one. You pass 15 pictures with a cat, 20 images with a dog, and 12 pictures with a bird to the model. The predictions are as follows:
- 15 cat images: 9 dog pictures, 3 bird ones, and 15 - 9 - 3 = 3 cat images;
- 20 dog images: 6 cat pictures, 4 bird ones, and 20 - 6 - 4 = 10 dog images;
- 12 bird images: 4 dog pictures, 2 cat ones, and 12 - 4 - 2 = 6 bird images.
Let’s build the matrix.
Macro Precision score calculation example
Macro Precision score is a way to study the classification as a whole. To calculate the Macro Precision score, you need to compute the metric independently for each class and take the average of the sum. The Macro approach treats all the classes equally as it aims to see the bigger picture and evaluate the algorithm’s performance across all the classes in one value.
Let’s calculate the Precision value for each class. To do so, we need to go row by row (the green cell is the True Positives predictions for a specific class whereas red cells are False Positives):
- Dog Precision: 10 / (4 + 9 + 10) ~ 0.43
- Bird Precision: 6 / (4 + 3 + 6) ~ 0.46
- Cat Precision: 3 / (6 + 2 + 3) ~ 0.27
- Macro Precision score: (Dog Precision + Bird Precision + Cat Precision) / 3 = (0.43 + 0.46 + 0.27) / 3 ~ 0.386
Micro Precision score calculation example
On the other hand, the Micro Precision score studies individual classes. To calculate it, you need to sum all True Positives and divide by the sum of all True Positives and False Positives predictions across all the classes. Thus, Micro Precision will combine the contributions of all classes to calculate the average metric.
Let’s calculate the Micro Precision score value for our use case
- Micro Precision score: (TP Dog + TP Bird + TP Cat) / ((TP + FP) Dog + (TP + FP) Bird + (TP + FP) Cat) = (10 + 6 + 3) / ((4 + 9 + 10) + (4 + 3 + 6) + (6 + 2 + 3)) ~ 0.4
Precision score in Python
The Precision score is widely used in the industry, so all the Machine and Deep Learning libraries have their own implementation of this metric. For this page, we prepared three code blocks featuring calculating Precision in Python. In detail, you can check out:
- Precision score in Scikit-learn (Sklearn);
- Precision score in TensorFlow;
- Precision score in PyTorch.
Precision score in Sklearn (Scikit-learn)
Scikit-learn is the most popular Python library for classical Machine Learning. From our experience, Sklearn is the tool you will likely use the most to calculate Precision (especially, if you are working with the tabular data). Fortunately, you can do it in a blink of an eye.