Precision-Recall curve
If you have ever tried solving a Classification task using a Machine Learning (ML) algorithm, you might have heard of a well-known Precision and Recall ML metrics. Although you can evaluate your model using the metrics separately, it is always worth checking their relationship to see the bigger picture. That is where the Precision-Recall curve comes into the mix. On this page, we will:
Сover the logic behind the Precision-Recall curve (both for the binary and multiclass cases);
Break down the tradeoff between the Precision and Recall scores;
Find out how to interpret the PR curve and AUC-PR value;
And see how to work with the Precision-Recall curve using Python.
Let’s jump in.
Precision Vs. Recall
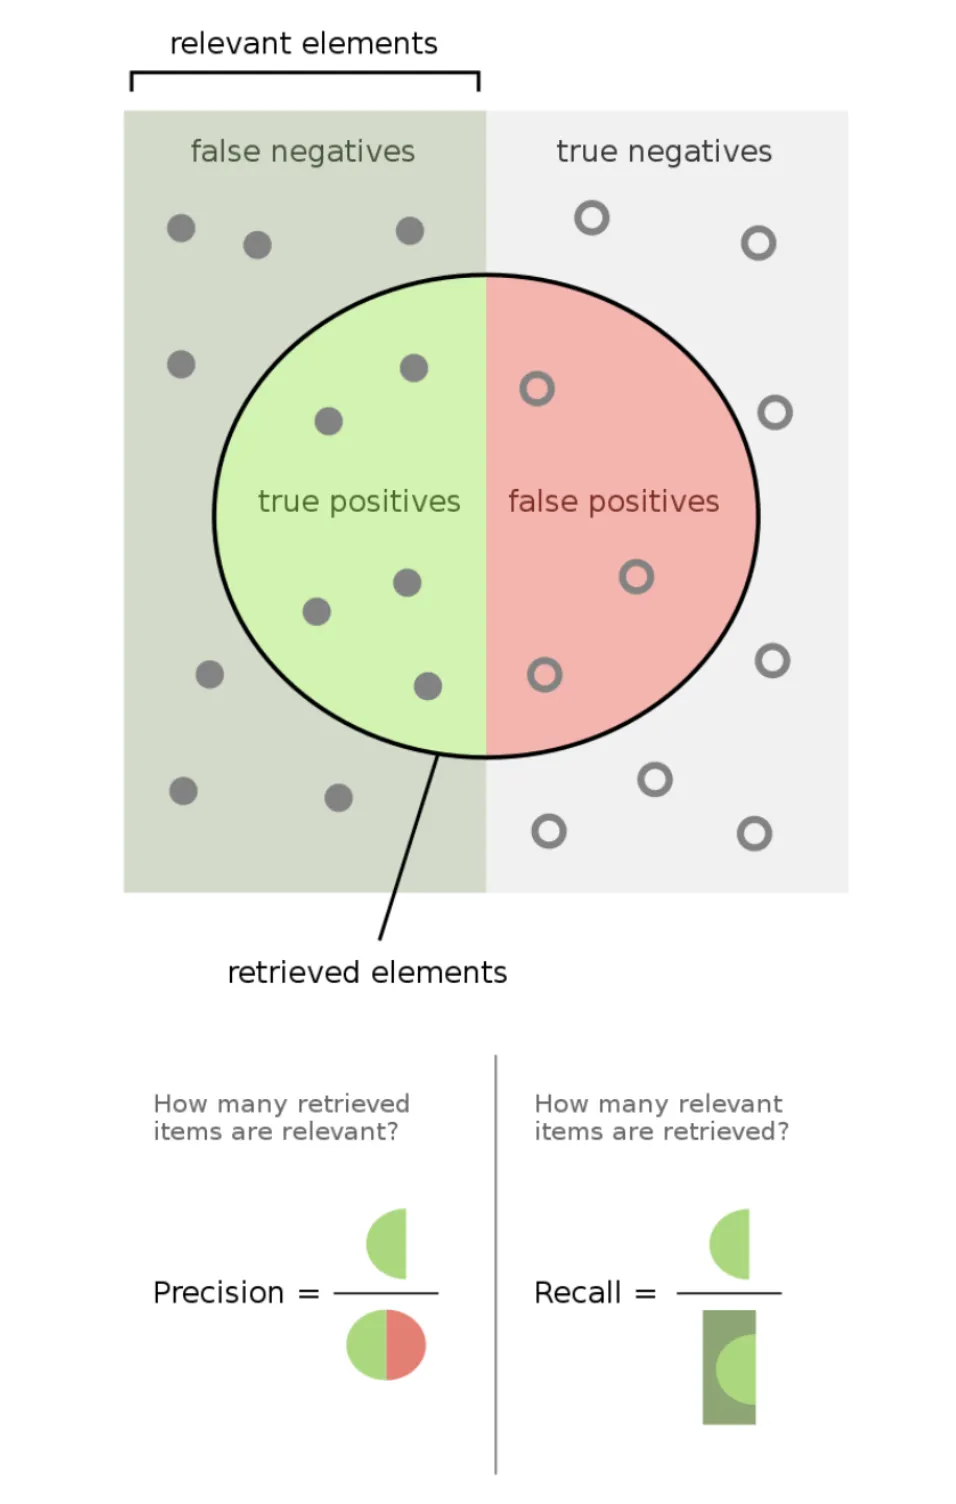
The Precision score is a Classification metric featuring a fraction of predictions of the Positive class that are Positive by ground truth. In other words, Precision measures the ability of a classifier not to label as Positive a Negative sample.

Source
The Recall score is a Classification metric featuring a ratio of predictions of the Positive class that are Positive by ground truth to the total number of Positive samples. In other words, Recall measures the ability of a classifier to detect Positive samples.

Source
To summarize, Precision and Recall score Machine Learning metrics are not competing. On the contrary, they complement one another, helping Data Scientists conduct a more comprehensive analysis of the models.

Source
Precision and Recall curve explained
To define the term, the Precision-Recall curve (or just PR curve) is a curve (surprise) that helps Data Scientists to see the tradeoff between Precision and Recall across various thresholds. You already know what Precision and Recall scores are, so let’s clarify what we mean by thresholds.
As you might know, when predicting a class on some sample, Classification algorithms output the probability (or probabilities) of an object to correspond to a specific class. The probability value is then compared to a certain threshold to classify an object into a class.
For example, imagine having three thresholds (0.3, 0.5, and 0.7). You pass four samples to your model, get its predictions, and then manually assign a class to an object depending on a threshold. If the probability of a sample being Positive is more significant than a threshold, we will assign such a sample to the Positive class. Otherwise, it will be classified as a Negative one.
0.4 | 0.6 | Positive | Negative | Negative |
0.6 | 0.4 | Positive | Positive | Negative |
0.55 | 0.45 | Positive | Positive | Negative |
0.1 | 0.9 | Negative | Negative | Negative |
As you can see, the predicted class varies from threshold to threshold, which means that Precision and Recall values also depend on the threshold.
This brings us to calculating Precision and Recall scores across many thresholds. With such data, we can build a graph with Precision on the y-axis and Recall on the x-axis. Thus, we will be able to check how the metrics' values change depending on the threshold. The algorithm for building a PR curve for both binary and multiclass Classification tasks is as follows:
Select thresholds (as many as you want or need);
Get the predictions from your model;
Calculate the Precision and Recall scores across all the thresholds (in the multiclass case, you can compute Micro or Macro Precision/Recall, for example);
With the obtained values, build a graph with Precision as the y-axis and Recall as the x-axis.
Precision and Recall curve visualized
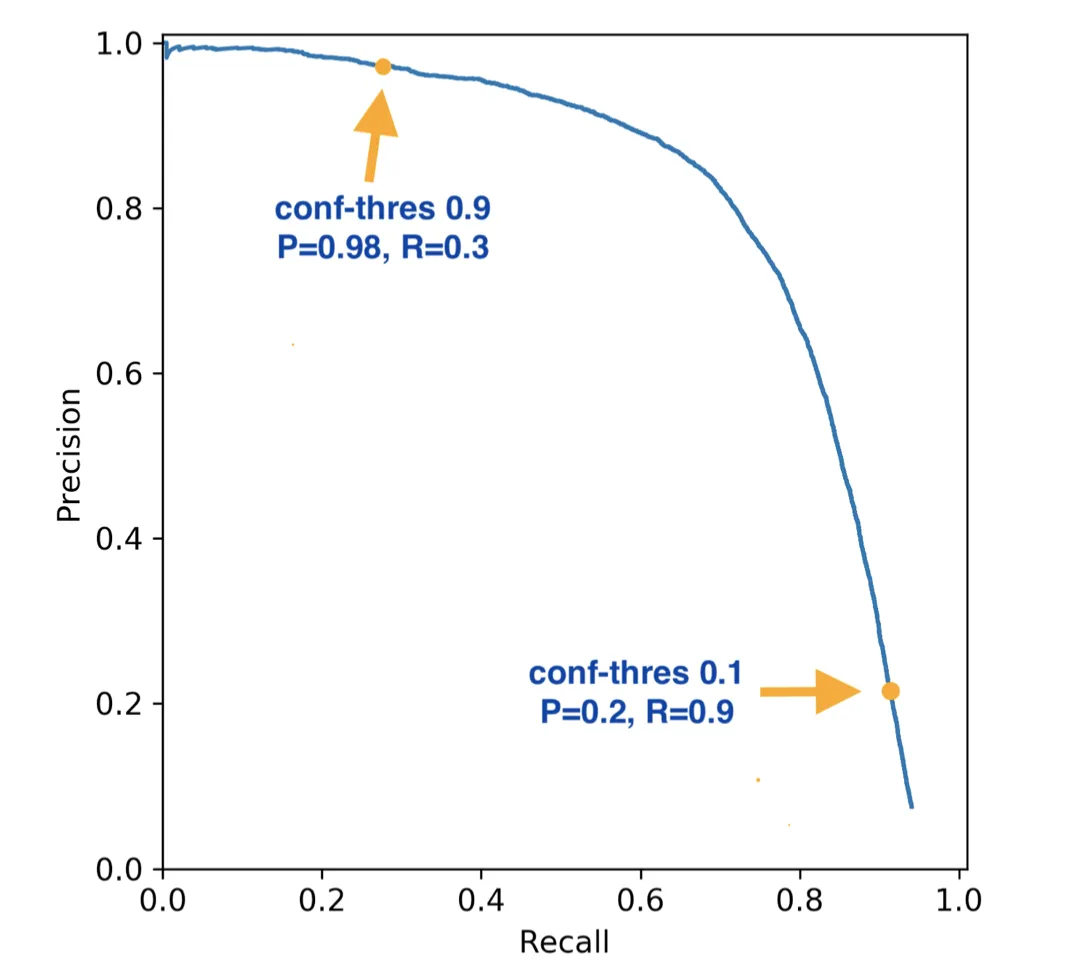
That is pretty much it. If you follow this algorithm, you will get a curve that should look somewhat similar to the following one:

Source
As you can see, the graph has a descending trend. The lower the threshold, the more False Positive predictions you get (basically, you say that more instances are Positive, for example, an object is Positive when the probability of it being Positive is 0.15 because your threshold is 0.1). It works and vice versa. If a threshold is high, you will get many False Negative predictions as you misclassify many Positive instances. This tradeoff between False Positives and False Negatives is what Data Scientists mean when discussing the Precision and Recall tradeoff.
Interpreting Precision and Recall curve
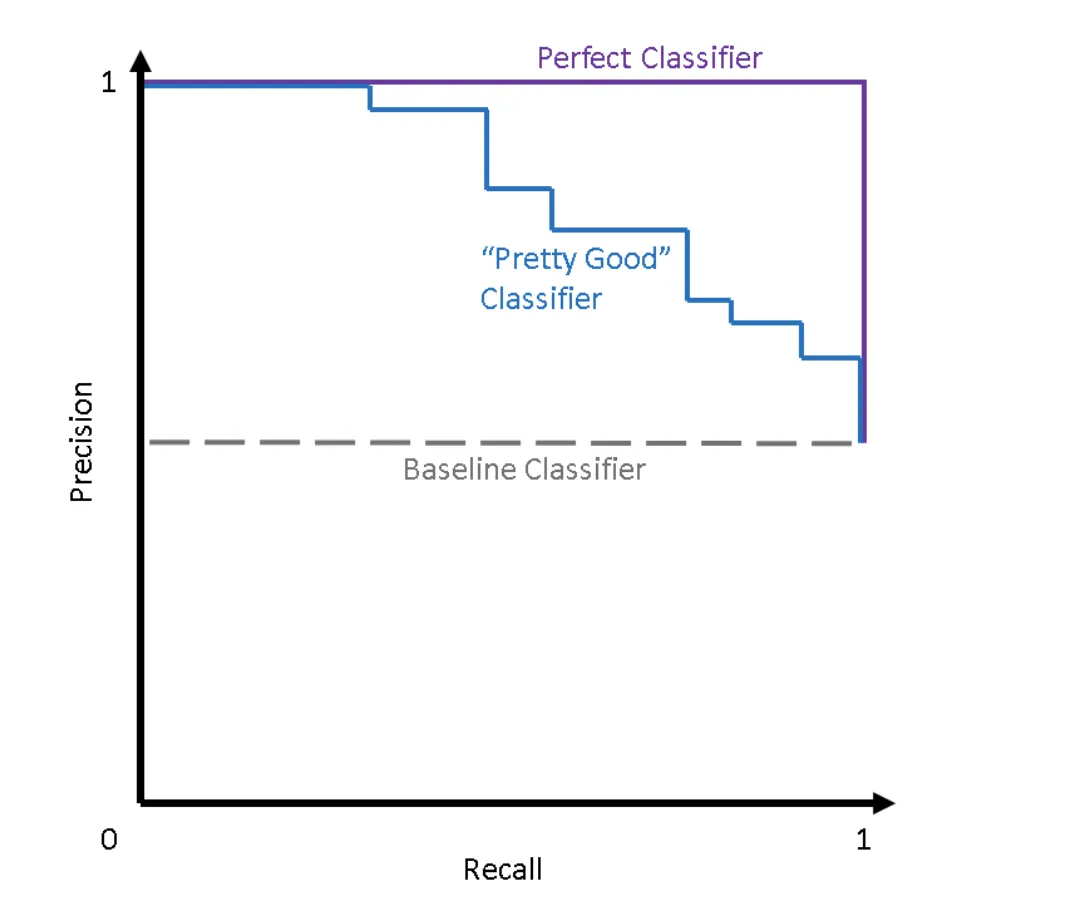
So, as we understood, the PR curve shows the tradeoff between Precision and Recall scores across different thresholds. If your model is perfect (Precision and Recall are equal to 1), your PR curve will look as follows:

Pay attention to the Perfect Classifier curve
Source
With the help of the PR curve, you will be able to choose the best threshold value for your task depending on the False Positive or False Negative misclassification cost. For example, in medicine, you might want to avoid False Negatives, whereas False Positives are a no-go in other fields.
Additionally, it is worth mentioning that the PR curve is primarily used in those cases when researchers have heavily imbalanced data, such as medicine, finance, investments, etc. It happens because Precision and Recall are imbalance proof which makes them a good fit for such tasks.
AUC-PR
Moreover, you can calculate the area under the Precision-Recall curve (AUC-PR). AUC-PR is a Machine Learning metric that can assess Classification algorithms. Still, it is not as popular as the AUC-ROC metric, which is also based on measuring the area under some curve, so you might not have to use AUC-PR in your work often. Anyway, the best possible value for AUC-PR is 1, and the worst is 0.
Precision and Recall curve in Python
The Precision-Recall curve is not that popular in the industry. Still, many Machine and Deep Learning libraries have their own implementation of this metric. On this page, we decided to present only one code block featuring working with the Precision-Recall curve in Python through the Scikit-learn (sklearn) library.
PR curve in Sklearn (Scikit-learn)
Today, Sklearn has at least two functions that you can use to work with the Precision-Recall curve. For example:
Still, we suggest you use either PrecisionRecallDisplay or precision_recall_curve as they are up-to-date and were updated to correspond to the latest iteration of Scikit-learn.
